Welcome to Mathematica's Financial Inclusion Dashboard!
This interactive data dashboard was developed with funding from the Bill & Melinda Gates Foundation’s Financial Services for the Poor
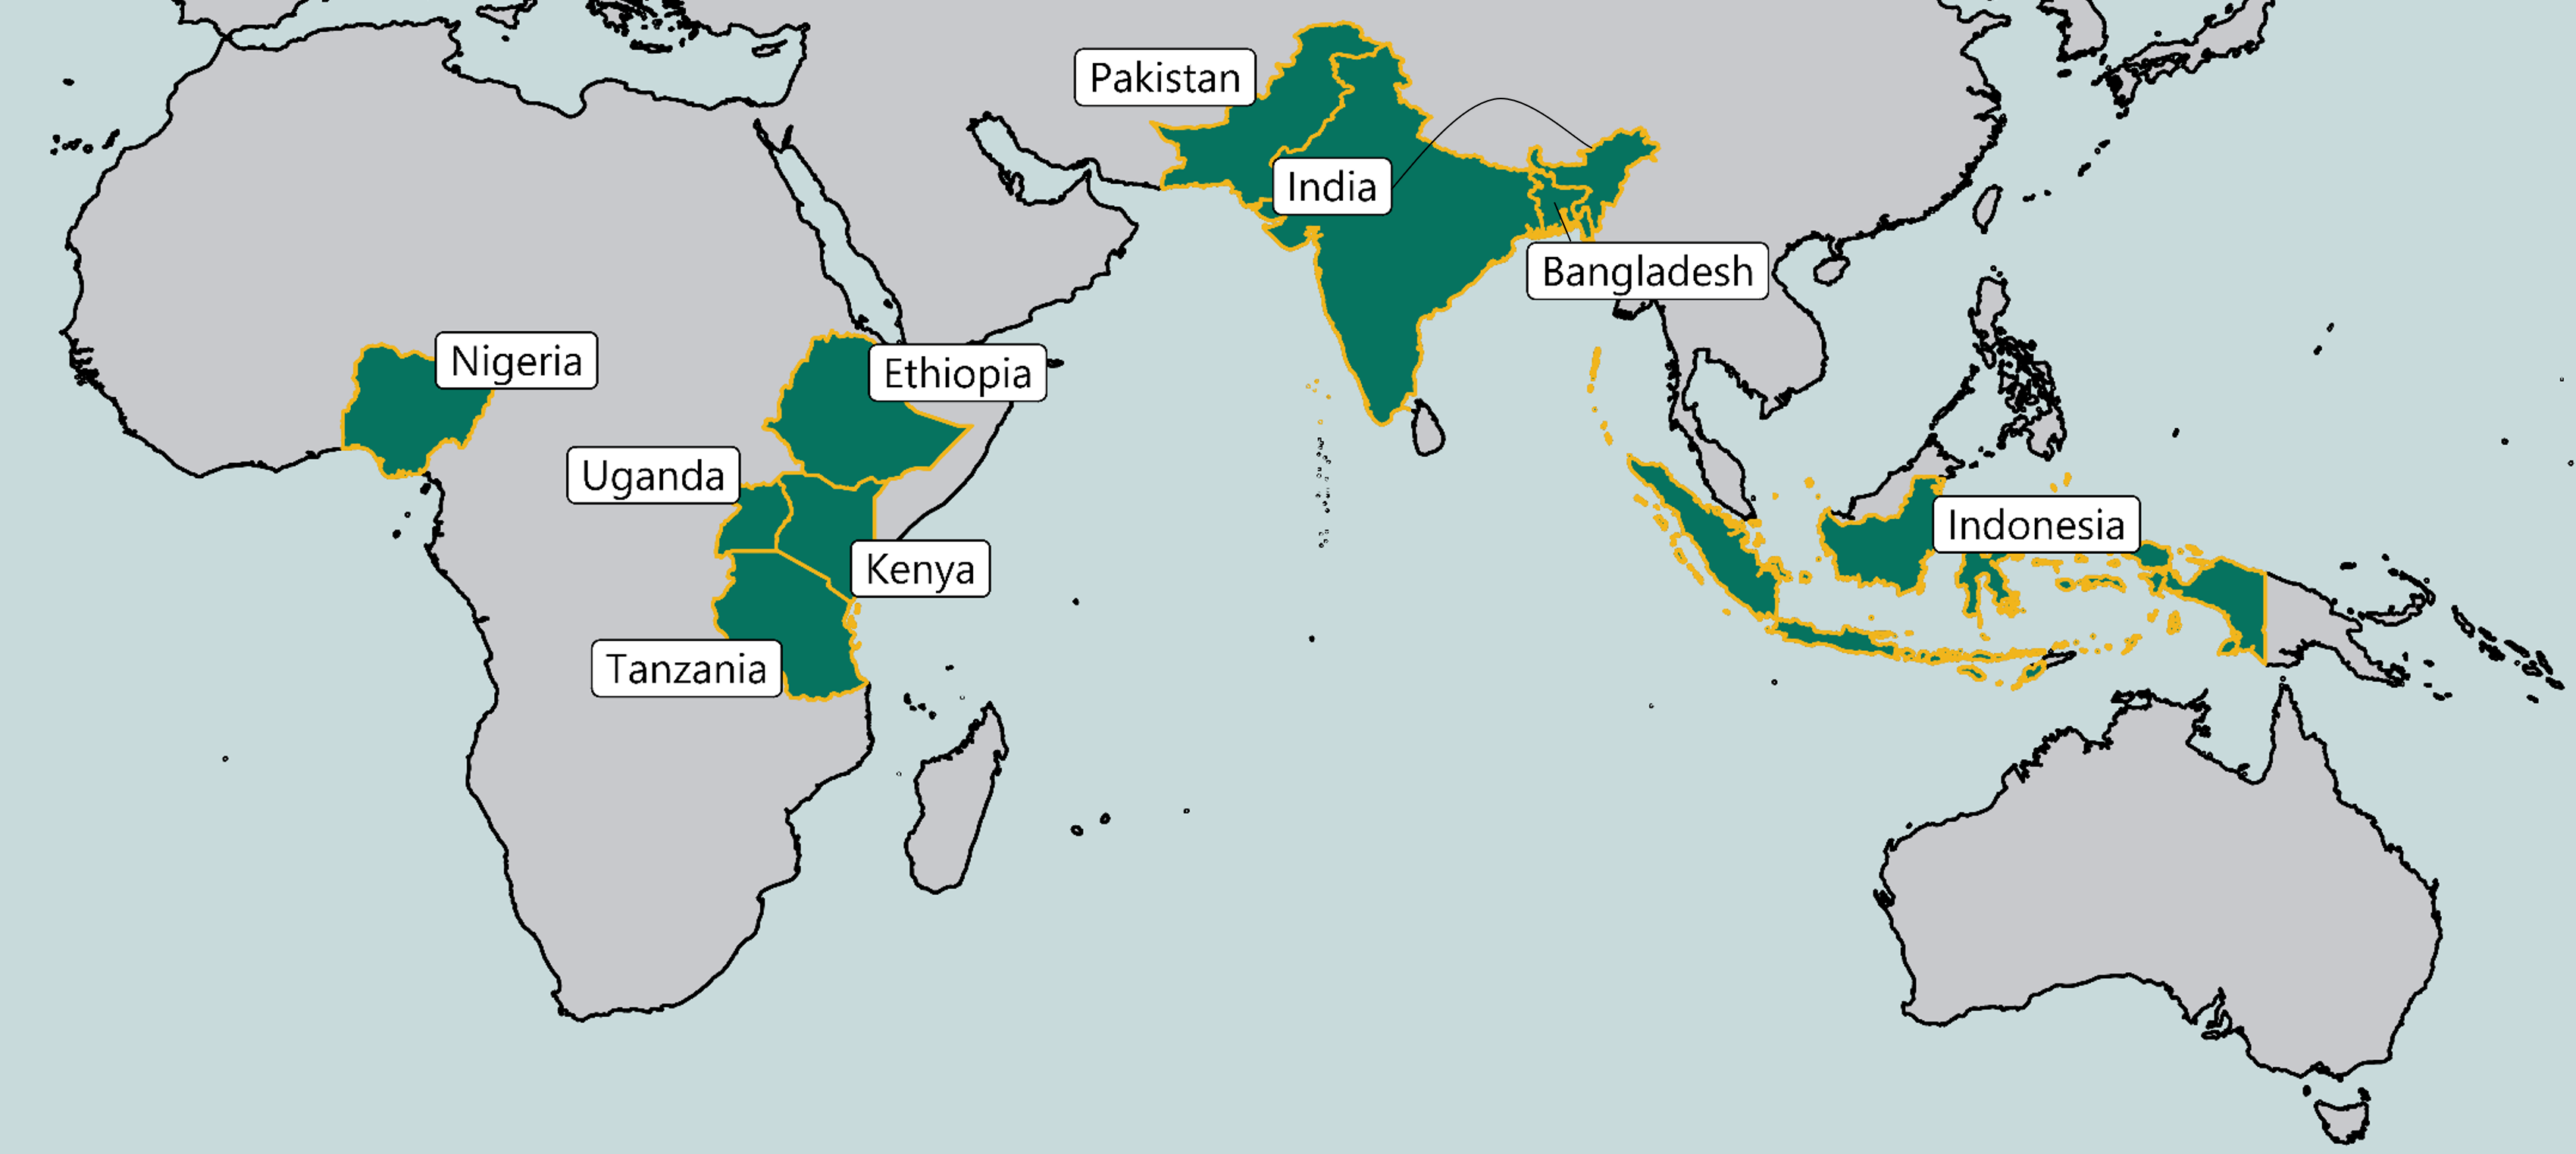
team and covers nine countries (Bangladesh, Ethiopia, India, Indonesia, Kenya, Nigeria, Pakistan, Tanzania, and Uganda). It allows the
user to explore the relationship between various population characteristics in the 2017 and 2021 Global Findex databases and changes
over time in those characteristics.
To get started, select "Explore Data" on the left and use the input options to customize your view of the data. You can use the download buttons to save the figures and tables generated by the dashboard.
In addition to key demographic and socioeconomic characteristics, the dashboard divides the population into four segments which indicate the degree of and potential for financial inclusion:
More information about the segments and our methodology is provided in the "Documentation" section on the left. Please contact info@mathematica-mpr.com for additional information and inquiries.
We hope that this dashboard provides useful insights.
- The Mathematica Team

To get started, select "Explore Data" on the left and use the input options to customize your view of the data. You can use the download buttons to save the figures and tables generated by the dashboard.
In addition to key demographic and socioeconomic characteristics, the dashboard divides the population into four segments which indicate the degree of and potential for financial inclusion:
- Excluded and marginalized
- Excluded and high potential
- Included but underserved
- Included and not underserved
More information about the segments and our methodology is provided in the "Documentation" section on the left. Please contact info@mathematica-mpr.com for additional information and inquiries.
We hope that this dashboard provides useful insights.
- The Mathematica Team
Geographic Coverage:
Notes:
Sample sizes are displayed above each bar and reflect the number of Findex respondents. Results are dimmed for
estimates based on samples of fewer than 100 respondents. Population estimates are shown in parentheses in tables.
Sub-group population estimates may not add up to total population estimates due to missing data and rounding.
Data on self-employment is not available in 2021.
The most recent round of data collection in Bangladesh occurred in early 2022 rather than 2021. The World Bank still
considers this data as part of the Global Findex 2021 data catalog.
The most recent round of data collection in Ethiopia occurred in 2022 rather than 2021. The World Bank still
considers this data as part of the Global Findex 2021 data catalog.
Ethiopia 2021 data excludes Tigray, Gambella, and Harari regions, representing about 7% of the total population.
India 2017 data excludes populations living in Northeast states and remote islands, representing less than 10% of the total population.
India 2021 data excludes populations living in Northeast states, remote islands, Jammu, and Kashmir,
representing less than 10% of the total population.
Nigeria 2017 data exludes Adamawa, Borno, and Yobe states, representing about 7% of the total population.
Nigeria 2021 data excludes Adamawa, Borno, and Yobe states, representing about 7% of the total population.
Pakistan 2021 data excludes Azad Jammu and Kashmir (AJK) and Gilgit Baltistan, representing about 5% of the total population.
Uganda 2021 data excludes Kotido, Moroto, and Nakapiripirit districts, representing 2% or less of the total population.
Notes:
Sample sizes are displayed above each bar and reflect the number of Findex respondents. Results are dimmed for
estimates based on samples of fewer than 100 respondents. Population estimates are shown in parentheses in tables.
Sub-group population estimates may not add up to total population estimates due to missing data and rounding.
*Data on self-employment is not available in 2021.
The most recent round of data collection in Bangladesh occurred in early 2022 rather than 2021. The World Bank still
considers this data as part of the Global Findex 2021 data catalog.
The most recent round of data collection in Ethiopia occurred in 2022 rather than 2021. The World Bank still
considers this data as part of the Global Findex 2021 data catalog.
Ethiopia 2021 data excludes Tigray, Gambella, and Harari regions, representing about 7% of the total population.
India data excludes populations living in Northeast states and remote islands in 2017, in addition to Jammu and Kashmir in 2021,
representing less than 10% of the total population in each year.
Nigeria 2017 and 2021 data excludes Adamawa, Borno, and Yobe states, representing about 7% of the total population.
Pakistan 2021 data excludes Azad Jammu and Kashmir (AJK) and Gilgit Baltistan, representing about 5% of the total population.
Uganda 2021 data excludes Kotido, Moroto, and Nakapiripirit districts, representing 2% or less of the total population.
In the slides below, we provide additional information about how the financial inclusion segments referenced in the dashboard were defined.
We also provide more information about the construction of two other characteristics shown in the dashboard: employment sector and government-to-person (G2P) payment receipt.
We also provide more information about the construction of two other characteristics shown in the dashboard: employment sector and government-to-person (G2P) payment receipt.
Data Sources and Notes
Demographic characteristics and measures of financial inclusion:
Global Findex Database
- 2017 Version 2
- 2021 Version 1 (excluding Ethiopia)
- 2021 Version 3 (Ethiopia)
- 2017 (accessed 7/25/2022)
- 2021 (accessed 10/19/2022, excluding Ethiopia)
- 2022 (accessed 7/26/2023, Ethiopia)
- Findex classifies urban and rural respondents based on the UN Statistical Commission’s Degree of Urbanization metric, which uses population grids, not administrative units, to directly capture the spatial concentration of people.
Acknowledgements
This analysis and dashboard presentation were prepared by Mathematica in support of the Bill & Melinda Gates Foundation’s
Financial Services for the Poor team. Mathematica’s team is led by Nancy Murray. The Global Findex data analysis and dashboard
were prepared by Grant Anapolle, Jane Fortson, Sam Studnitzer, and Abbie Turiansky at Mathematica. Additional Mathematica staff,
including Anthony D’Agostino, Nick Ingwersen, Seth Morgan, Anitha Sivasankaran, Rebecca Strull, Pankhuri Prasad, and Delia Welsh,
contributed to related analyses. Huihua Lu and others provided technical support. Mathematica is grateful to the Financial Services
for the Poor team — especially Jamie Zimmerman, Victoria Griffith, Seth Garz, Hillary Miller-Wise, and Michael Weigand — and their
partners for their comments and support.